Dashboard
The Metrix Dashboard displays analytics from your connected sources. Arrange charts, tables and counters into views for the people who need that information.
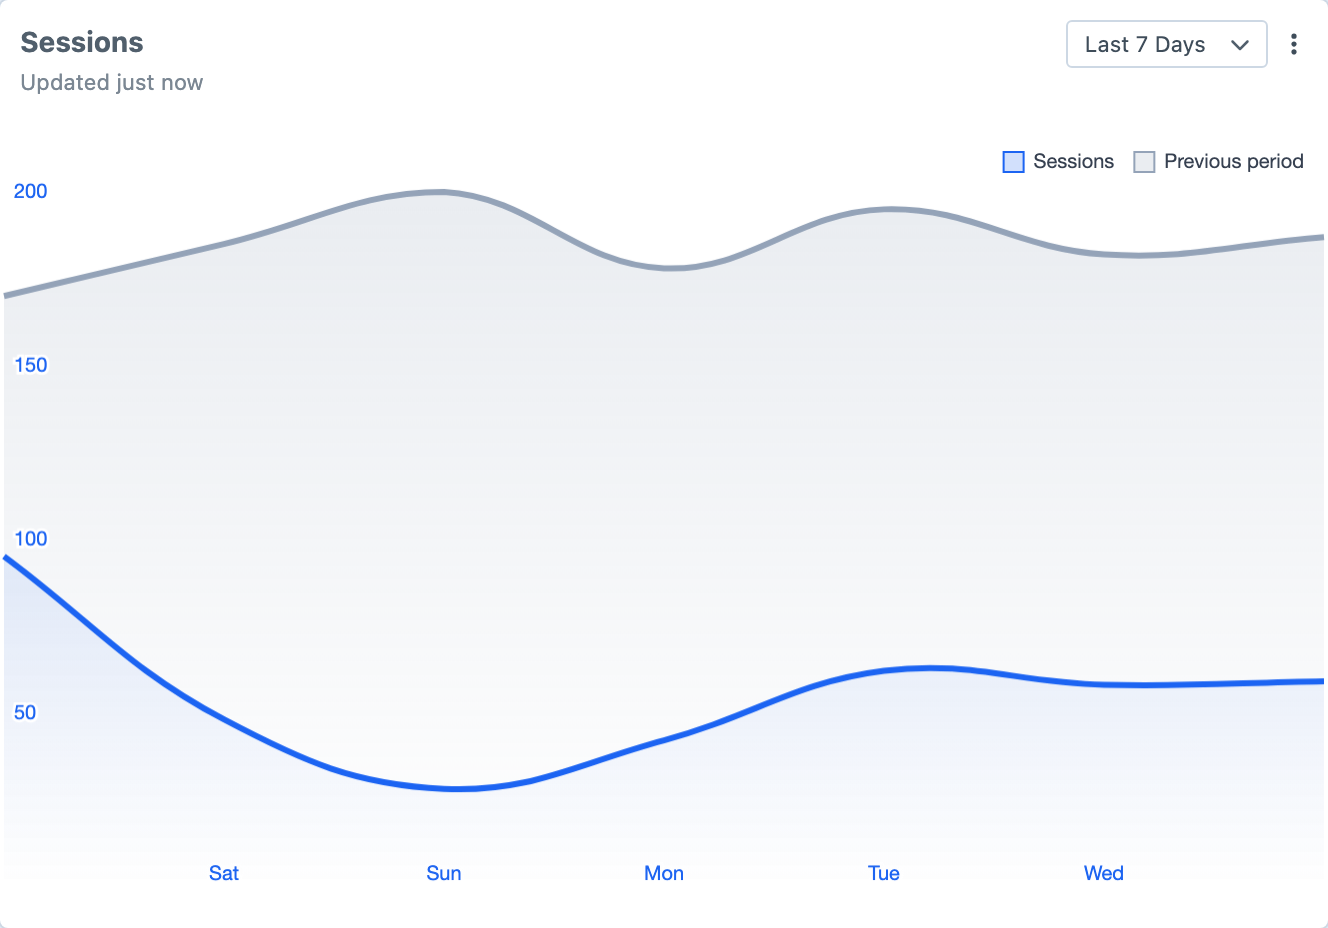
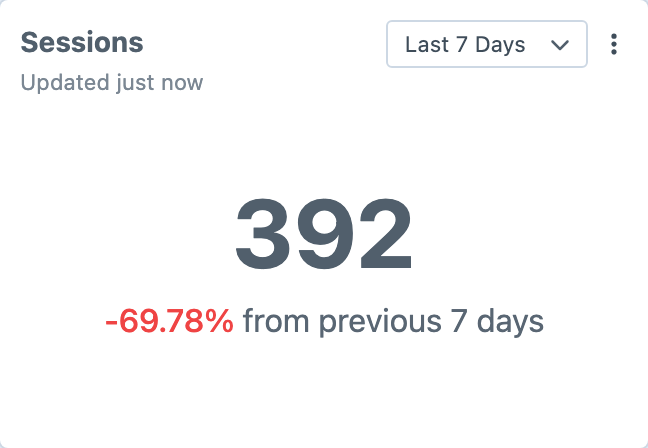
Each widget presents one part of the selected analytics data. For example, a content team can use a Sessions counter to see overall traffic, a line chart to spot changes over time and a table to identify popular pages. Creating Your First Dashboard Widget takes you through the first counter. The examples below show how the other presentation styles help answer different questions.
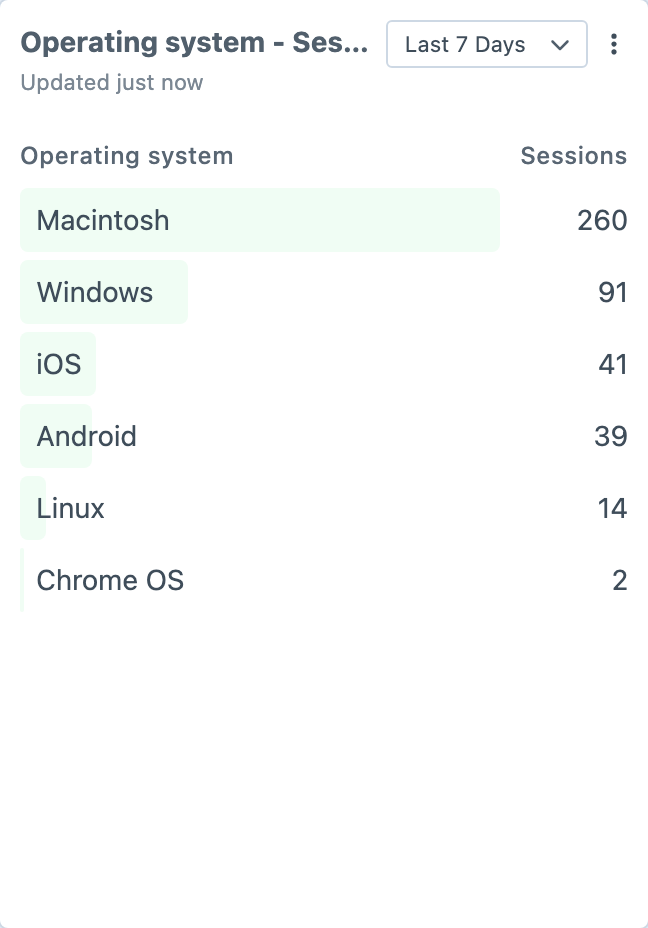
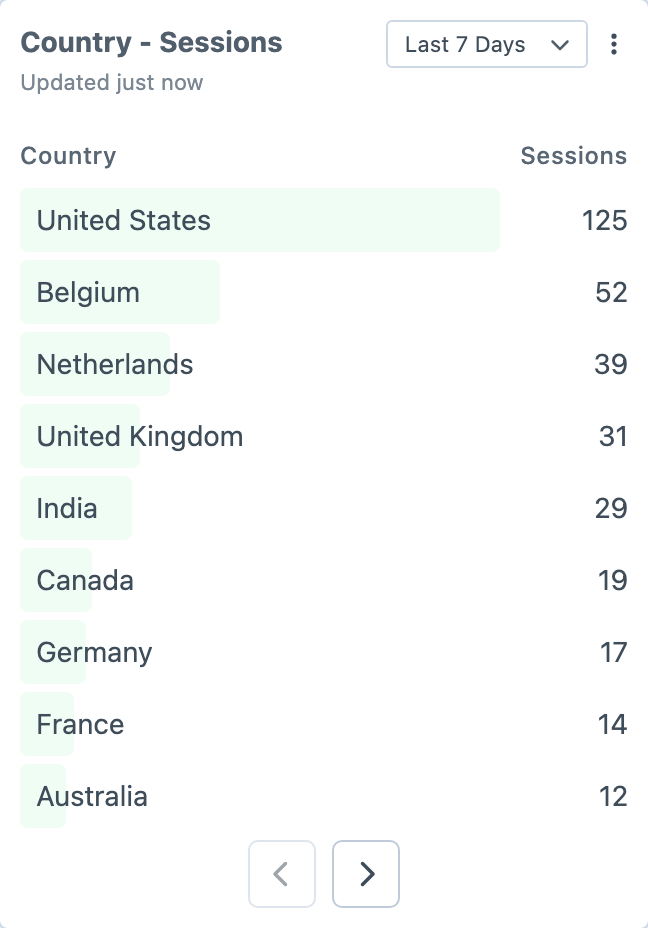
Unlike Craft Dashboard widgets, which are configured per user, Metrix Views share one analytics layout with everyone who has permission to view it.
Views
Views group widgets around an audience or task. Use the default View for general website traffic, or create a separate View for a campaign so its widgets stay together. Create and name Views under Metrix → Views, then select the View on the dashboard to work with its widgets.
Permissions
User groups can be limited with:
- Metrix → Dashboard — access the dashboard (with nested permissions per view).
- Metrix → Sources — manage Sources.
- Metrix → Manage views and dashboard layouts — create and configure Views, and add, edit, reorder or remove their shared widgets.
Multi-Site / Analytics Scope
A View can optionally limit widget data to a Craft site, path prefix, or hostname. Use this when one analytics property (e.g. a single GA4 property) covers multiple Craft sites.
- Craft site — Metrix derives a hostname or path filter from the site base URL.
- Path prefix — e.g.
/enor/fr/for path-based multi-site. - Hostname — e.g.
fr.example.comfor domain-based multi-site on one property.
For example, when one analytics property includes an English site under /en and a French site under /fr, edit the French View under Metrix → Views. Set Scope to the path option, enter /fr as Path prefix, and choose a prefix match. Save and compare a page breakdown with the provider to confirm only French paths are included.
If each Craft site has its own analytics property or Plausible site, create separate Sources and Views for those connections.
Providers that support View scope: Google Analytics, Plausible (path), and Matomo. Other sources ignore the scope.
Google Analytics Realtime widgets require an unscoped View because Google’s Realtime API does not support hostname or path filters.
Presets
A Preset supplies a starting collection of widgets when you create a View. Choose one that matches your task, then review each widget's Source and metric against the connected provider. Presets are stored in plugin settings and project config, so they can be shared with the project's other configuration.
Fresh installs include seeded presets such as Website Overview, Content Performance, Acquisition, and Realtime.
Widgets
Widgets visualise data as charts, tables, or counters.
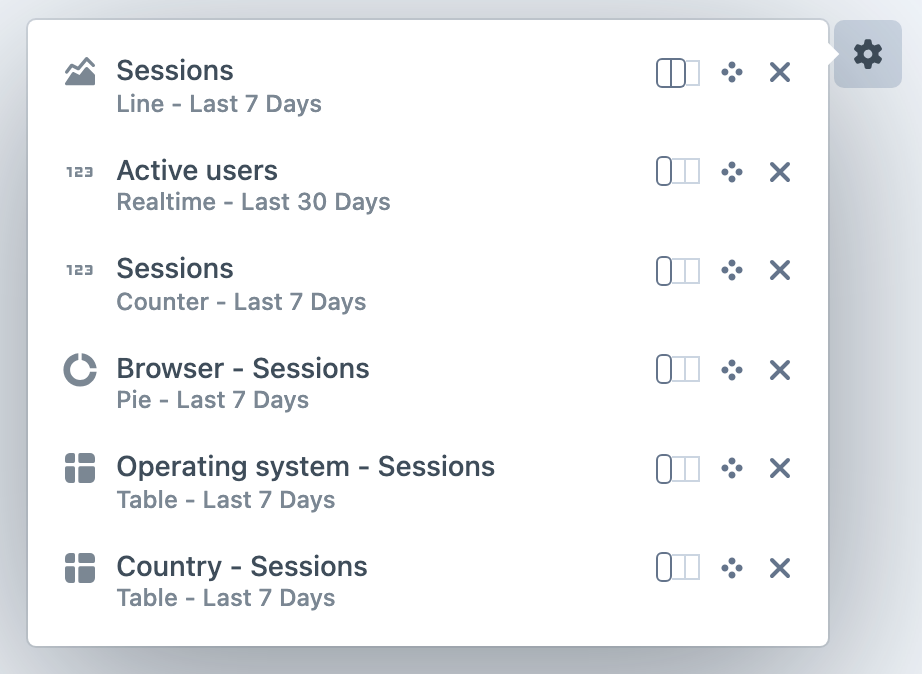
Widgets can take up 1, 2, or 3 thirds of the screen, and are responsive.
Manage the widget list from the view settings (or the Widgets tab when configuring presets):
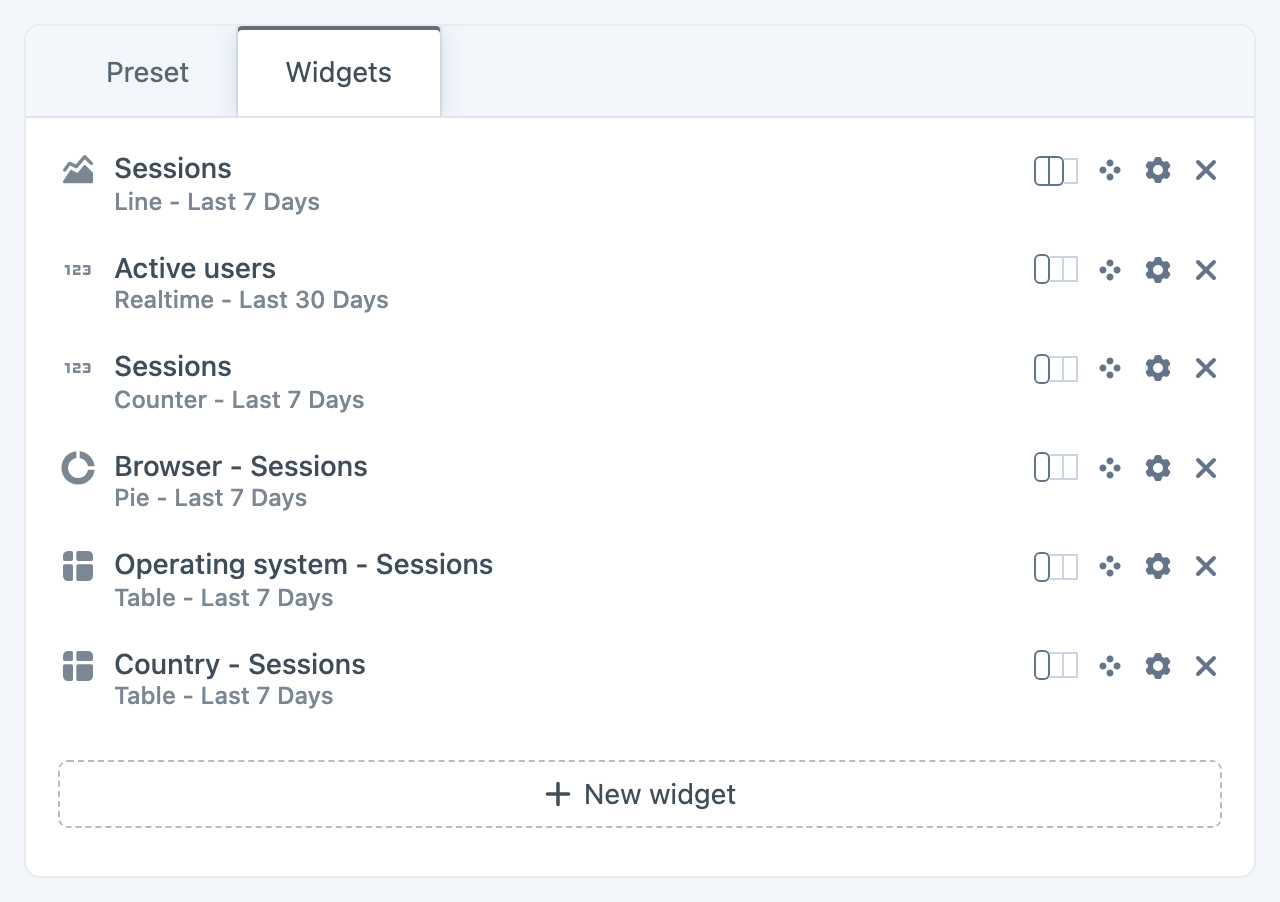
Widget Settings
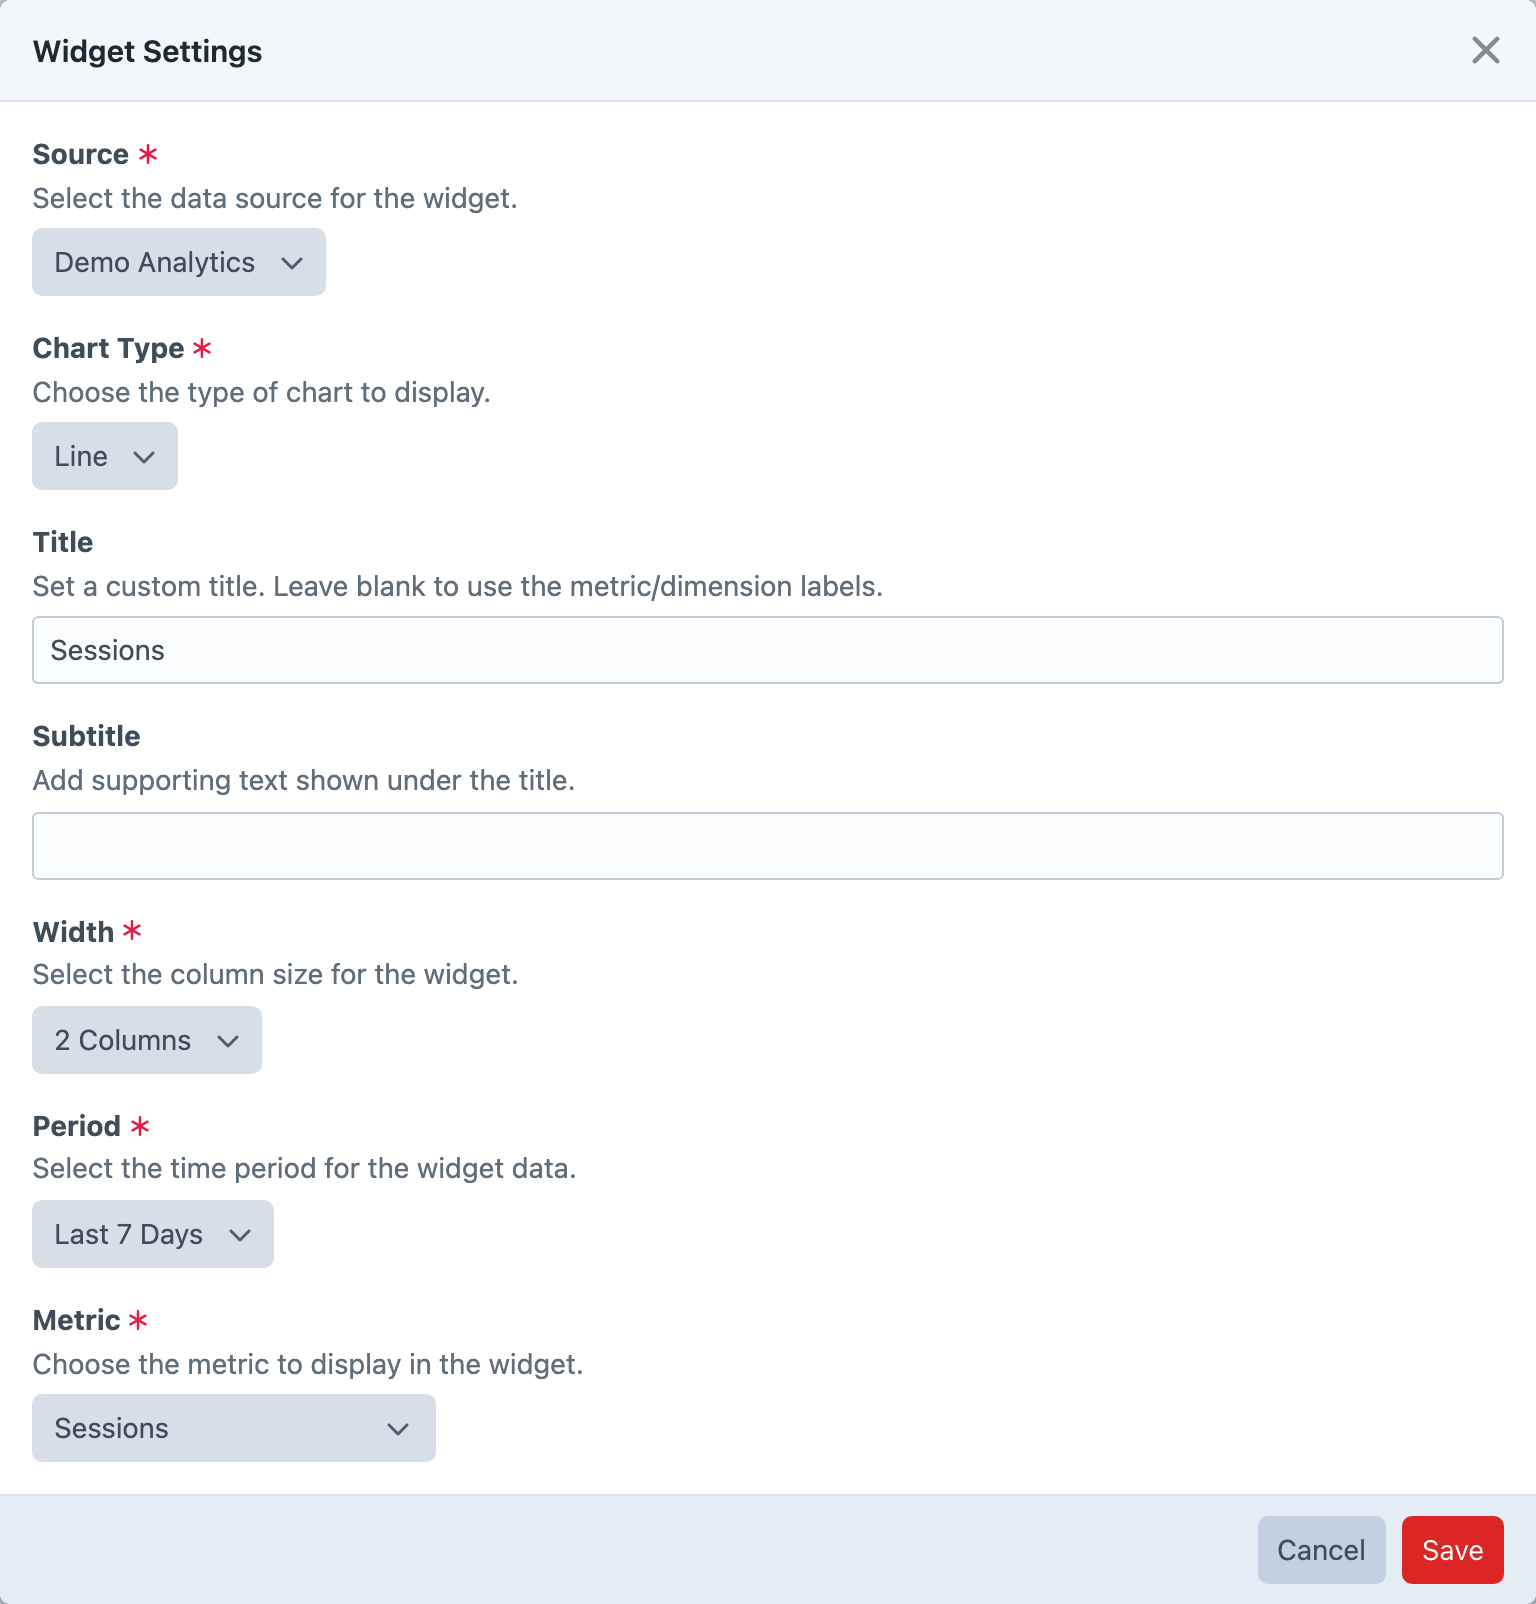
Choose the Source and the question the widget should answer. A metric is the value you want to measure, such as sessions or pageviews. A dimension groups that value, such as by page, country or browser. A table of popular pages therefore needs a pageview metric and a page dimension; a sessions counter needs only the metric.
Choose a chart type and width, then decide whether the widget should follow the View date range or use its own period. Give it a title that explains its purpose, such as “Most-read pages”; a subtitle can clarify the audience or filter. For a table or pie, set a row limit that keeps the result useful to scan.
Save the widget and check it against the same data in the provider account. Use Refresh in its actions menu to bypass cached data. The header records when that data was fetched, which helps distinguish an old result from a provider that has not received any new traffic.
Widget Types
Bar
Vertical bars for comparing categories or time periods — e.g. daily traffic for the last 7 days.
Counter
A key metric at a glance, with a comparison to the previous period.
Line
Trends over time. Line widgets can also show a previous-period comparison series when the selected period supports it.
Pie
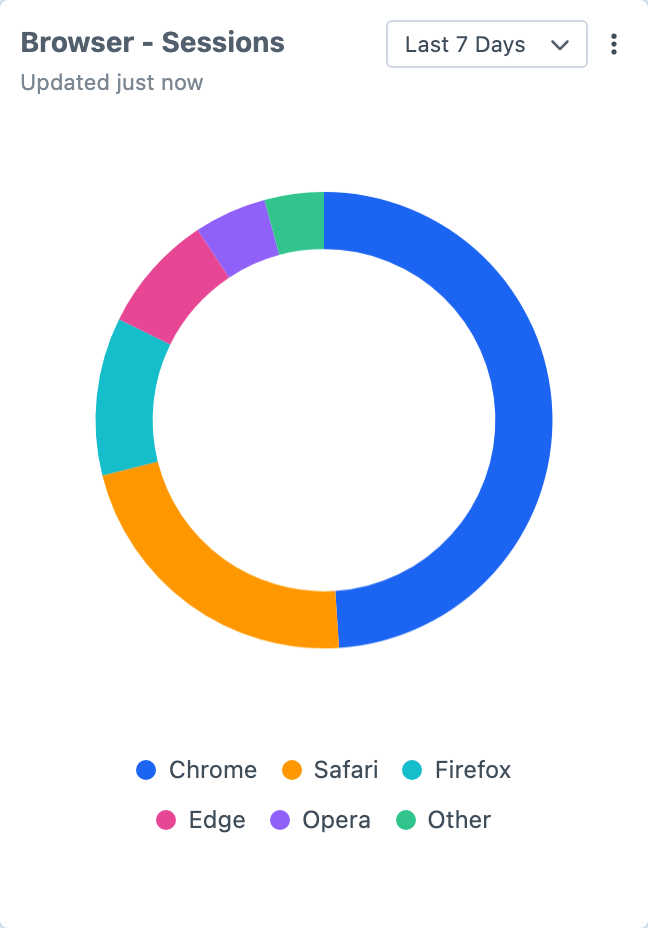
Proportions between segments — e.g. traffic by browser.
Realtime
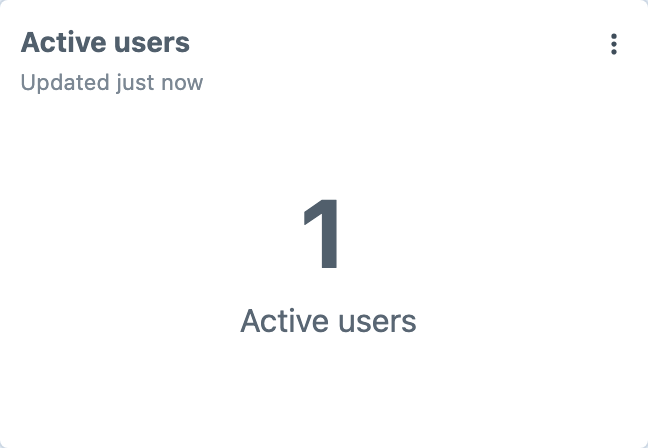
Live activity (where the Source supports it).
Table
Rows and columns for ranked breakdowns — e.g. pages by pageviews.
Periods
Once a View contains a widget, the dashboard header has a date range control. This selection applies while you are viewing the dashboard and resets when you reload or switch Views. Widgets with inheritance enabled use the selection, falling back to Last 30 Days when no dashboard range is selected; other widgets retain their own period. Choose Use dashboard date range from a widget’s actions menu to enable inheritance after selecting a dashboard range.
Available Periods
- Today
- Yesterday
- Last 7 Days
- Week to Date
- Last Week
- Last 30 Days
- Month to Date
- Last Month
- Last 12 Months
- Year to Date
- Last Year
- All Time