Creating Your First Dashboard Widget
Create a counter showing visits to your site, then give your content team access to it. This walkthrough uses Google Analytics and assumes its property already contains traffic data. You need an administrator account in Craft and permission to connect the Google Analytics account.
Connect Your Analytics Account
A Source is a saved connection to an analytics provider. Open Metrix → Sources, create a Google Analytics source named Website Analytics and give it the handle websiteAnalytics. A handle is the name you can use to refer to this connection in code.
Follow Connecting to Google Analytics to create the OAuth client, authorise the connection and select your account and property. Save the source and confirm it reports a connected account before continuing. A successful connection establishes access; it does not guarantee that the selected property contains traffic.
Add a Sessions Counter
A View is a shared dashboard layout. Open Metrix → Dashboard and use the default View for this first widget. If you have already configured an analytics scope on the View, use a View without a filter for this initial comparison.
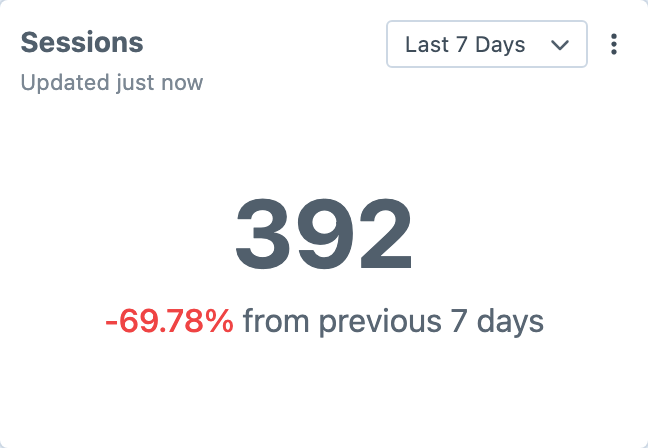
Click New widget. Choose Website Analytics as the source if you have more than one source, Counter as the chart type, Last 7 Days as the period and Sessions as the metric. Set Width to 1 Column, enter “Site sessions” as its title, then click Create.
The dashboard date range control appears after the first widget is created. To make this counter follow it, select Last 7 Days in that control, then choose Use dashboard date range from the counter’s actions menu.
The counter shows the number of sessions for the selected range. The source determines what each metric means; sessions count visits and can include repeat visits from the same person.
Check the Result
Open the same Google Analytics property and compare Sessions over the same dates. Check that the View is not filtering by Craft site, path or hostname. A zero is a valid result when there were no matching visits; an error message means the request did not complete successfully.
Use Refresh in the widget's actions menu to request data without using its cached result. If the figures still differ, check the exact dates and any provider-side filters before changing credentials. Troubleshooting explains the other common causes of missing data.
Share the View
In Settings → Users → User Groups, grant your content team's group access to Metrix → Dashboard and the intended View. Source and View management have separate permissions; grant those only when the group should manage the connection or dashboard layout.
Sign in as a member of that group and confirm the counter is visible. Change the dashboard date range and check that the counter follows it. You now have a shared, working widget; Dashboard explains how to combine it with charts, apply presets and filter a View to part of your site.